
The Australian benchmark index S&P/ASX 200 (XJO), which accounts for 82% of Australia's equity market recorded a +10.84% gain over the last year to 7,987.9 points, while the All Ordinaries (XAO) Index which is considered a total market barometer for the Australian stock market recorded +10.70% gain over the last year to 8,195.2 points on 10th Sep 2024. The S&P/ASX All Technology (XTX) index which is the benchmark for Australian technology-orientated companies recorded a +29.20% gain over the last year to 3,304.4 points.
Where is the Australian economy and equity market heading?
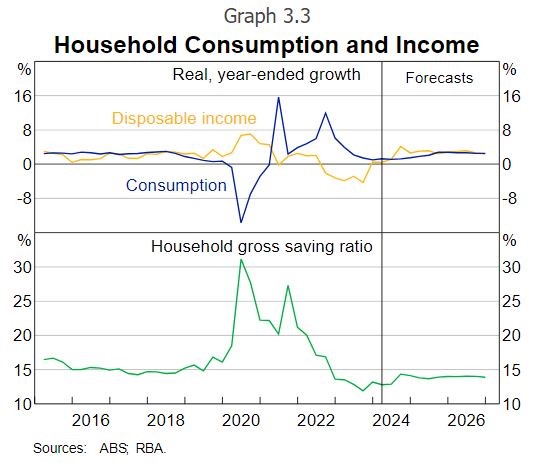
The Australian equity market was supported by the accommodative stance of the Reserve Bank of Australia (RBA) and a positive outlook on consumption growth. In its latest monetary policy statement in Aug 2024, the Reserve Bank of Australia (RBA) left the cash rate unchanged at 4.35% despite the stickiness of headline inflation, which remains well above its 2-3% target range. The RBA also affirmed that the recovery in Australian GDP growth over the next year is expected to be stronger than forecast three months ago, reflecting projected continued strength in public demand. Following a period of subdued activity, consumption growth is likely to increase in response to a rebound in real household disposable incomes, similar to expectations three months ago. In per capita terms, consumption is expected to increase in the second half of 2024 after having fallen for the past 18 months. Both real household income and wealth are expected to grow strongly over the forecast period 2024-2026; real household disposable income growth is expected to increase notably from mid-2024 as a result of the Stage 3 tax cuts and further declines in inflation.
How the reporting season 2023 has panned out?
So far more than 200 companies under our coverage have reported their results for the financial year ending on 30 June 2024(FY24). Here, we have discussed about some major players-
- Notably, resource majors like BHP and FMG have reported relatively stronger results compared to the prior year, largely due to higher realized prices and increased volumes. For FY24, BHP delivered a 3%YoY growth in revenue to US$55.7 billion and a 2% YoY growth in underlying attributable profit to US$ 13.7 billion, driven by higher volumes and realized iron ore and copper prices. For FY24, FMG delivered an 8% YoY growth in revenue to US$18.22 billion and a 3% YoY growth in underlying attributable NPAT to US$5.68 billion, driven by higher average hematite revenue and underlying EBITDA margin.
- The Banking major Commonwealth Bank of Australia (CBA) reported a relatively weak FY24, with the Net Interest Income declining by 1% YoY to $22824.00 million, driven by lower net interest margin, partly offset by volume growth in home and business lending. The Bank reported an 8bps decline in Net interest margin (NIM), driven by intense competition for home loans and customers switching to higher yield term deposits and a 2% YoY decline in Cash NPAT to $9836 million, reflecting the impact of inflation on operating expenses, partly offset by lower loan impairment expense.
- The consumer cyclical major Wesfarmers(WES) delivered a 1.5% YoY growth in revenue to $44189 million and a 3.3% YoY growth in EBIT to $3989 million, specifically driven by Wesfarmers Health and Kmart Group. Wesfarmers Health recorded 5.9% YoY growth in revenue to $5,624 million and increased earnings by 11.1% to $50 million for FY24, with Priceline delivering strong sales growth supported by store network expansion, promotional initiatives, and continued growth in online sales. Kmart Group increased its revenue by 4.4%YoY to $11,107 million in FY24 and increased earnings by 24.6% YoY to$958 million in FY24, reflecting Kmart’s lowest price positioning.
- The technology major WiseTech Global(WTC) delivered a 28% YoY growth in revenue to $ $1,041.7 million (FY23: $816.8 million), driven by strong growth in CargoWise (up 33% on FY23). EBITDA) grew 28% to $495.6 million, supported by price increases taken, operating leverage, and WiseTech's ongoing financial discipline. The reported EBITDA margin increased by 40 bps to 48% in FY24, ahead of expectations.
- For FY24, NEXTDC(NXT) delivered a solid performance and achieved a record level of new contracted sales (50.5MW), exceeding the top end of its FY24 underlying EBITDA Guidance range (A$204.3 million). The company delivered a 5% YoY growth in Underlying EBITDA to A$204.3 million (FY24 Guidance: A$190 – A$200 million).
ACE’s Take:
Overall, the equity market was driven by the accommodative stance of the RBA and a positive outlook on growth in consumption. Sectorwise, the resources sector has performed well, benefiting from higher realized iron ore and copper prices, whereas the banking and financial services sector has delivered weak financial performance affected by heightened competition in the home lending segment and customers switching to higher yield term deposits. The technology stocks have also done well driven by growth in demand supported by ongoing spending and recent announcements by federal and state and a reset cost base. The consumer cyclical sector has also performed well supported by stabilized supply chain and growth in consumption.
Disclaimer: Ace Investors Pty Ltd (ABN 70 637 702 188) authorized representative of Alpha Securities Pty Ltd (AFSL No.330757). Ace Investors has made all efforts to warrant the reliability and accuracy of the views and recommendations articulated in the reports published on its websites. Ace Investors' research is based on the information known to us or which was obtained from various sources which we believe to be reliable and accurate to the best of our knowledge. Ace Investors provides only general financial information through its website, reports and newsletters without considering the financial needs or investment objectives of any individual user. We strongly advocate that you seek advice, from your financial planner, advisor or stock broker, on the merit of each recommendation before acting on any recommendation for their specific financial circumstances and realize that not all investments will be suitable for all subscribers. To the scope permitted by law, Ace Investors Pty Ltd excludes all liability for any loss or damage arising from the use of this website and any information published (including any indirect or consequential loss, any data loss or data corruption). If the law prohibits this exclusion, Ace Investors Pty Ltd hereby limits its liability, to the scope permitted by law to resupply the services. The securities and financial products we study and share information on, in our reports, may have a product disclosure statement or other offer document associated with them. You should obtain a copy of these before making any decision about acquiring any security or product. You can refer to our Financial Services Guide.